TrackNControl
- Status
- Live
- Category
- Logistics SaaS
- Platform
- Web app · admin console
- Role
- Full-stack development
- Year
- 2026
Logistics SaaS · Web app · admin console · 2026
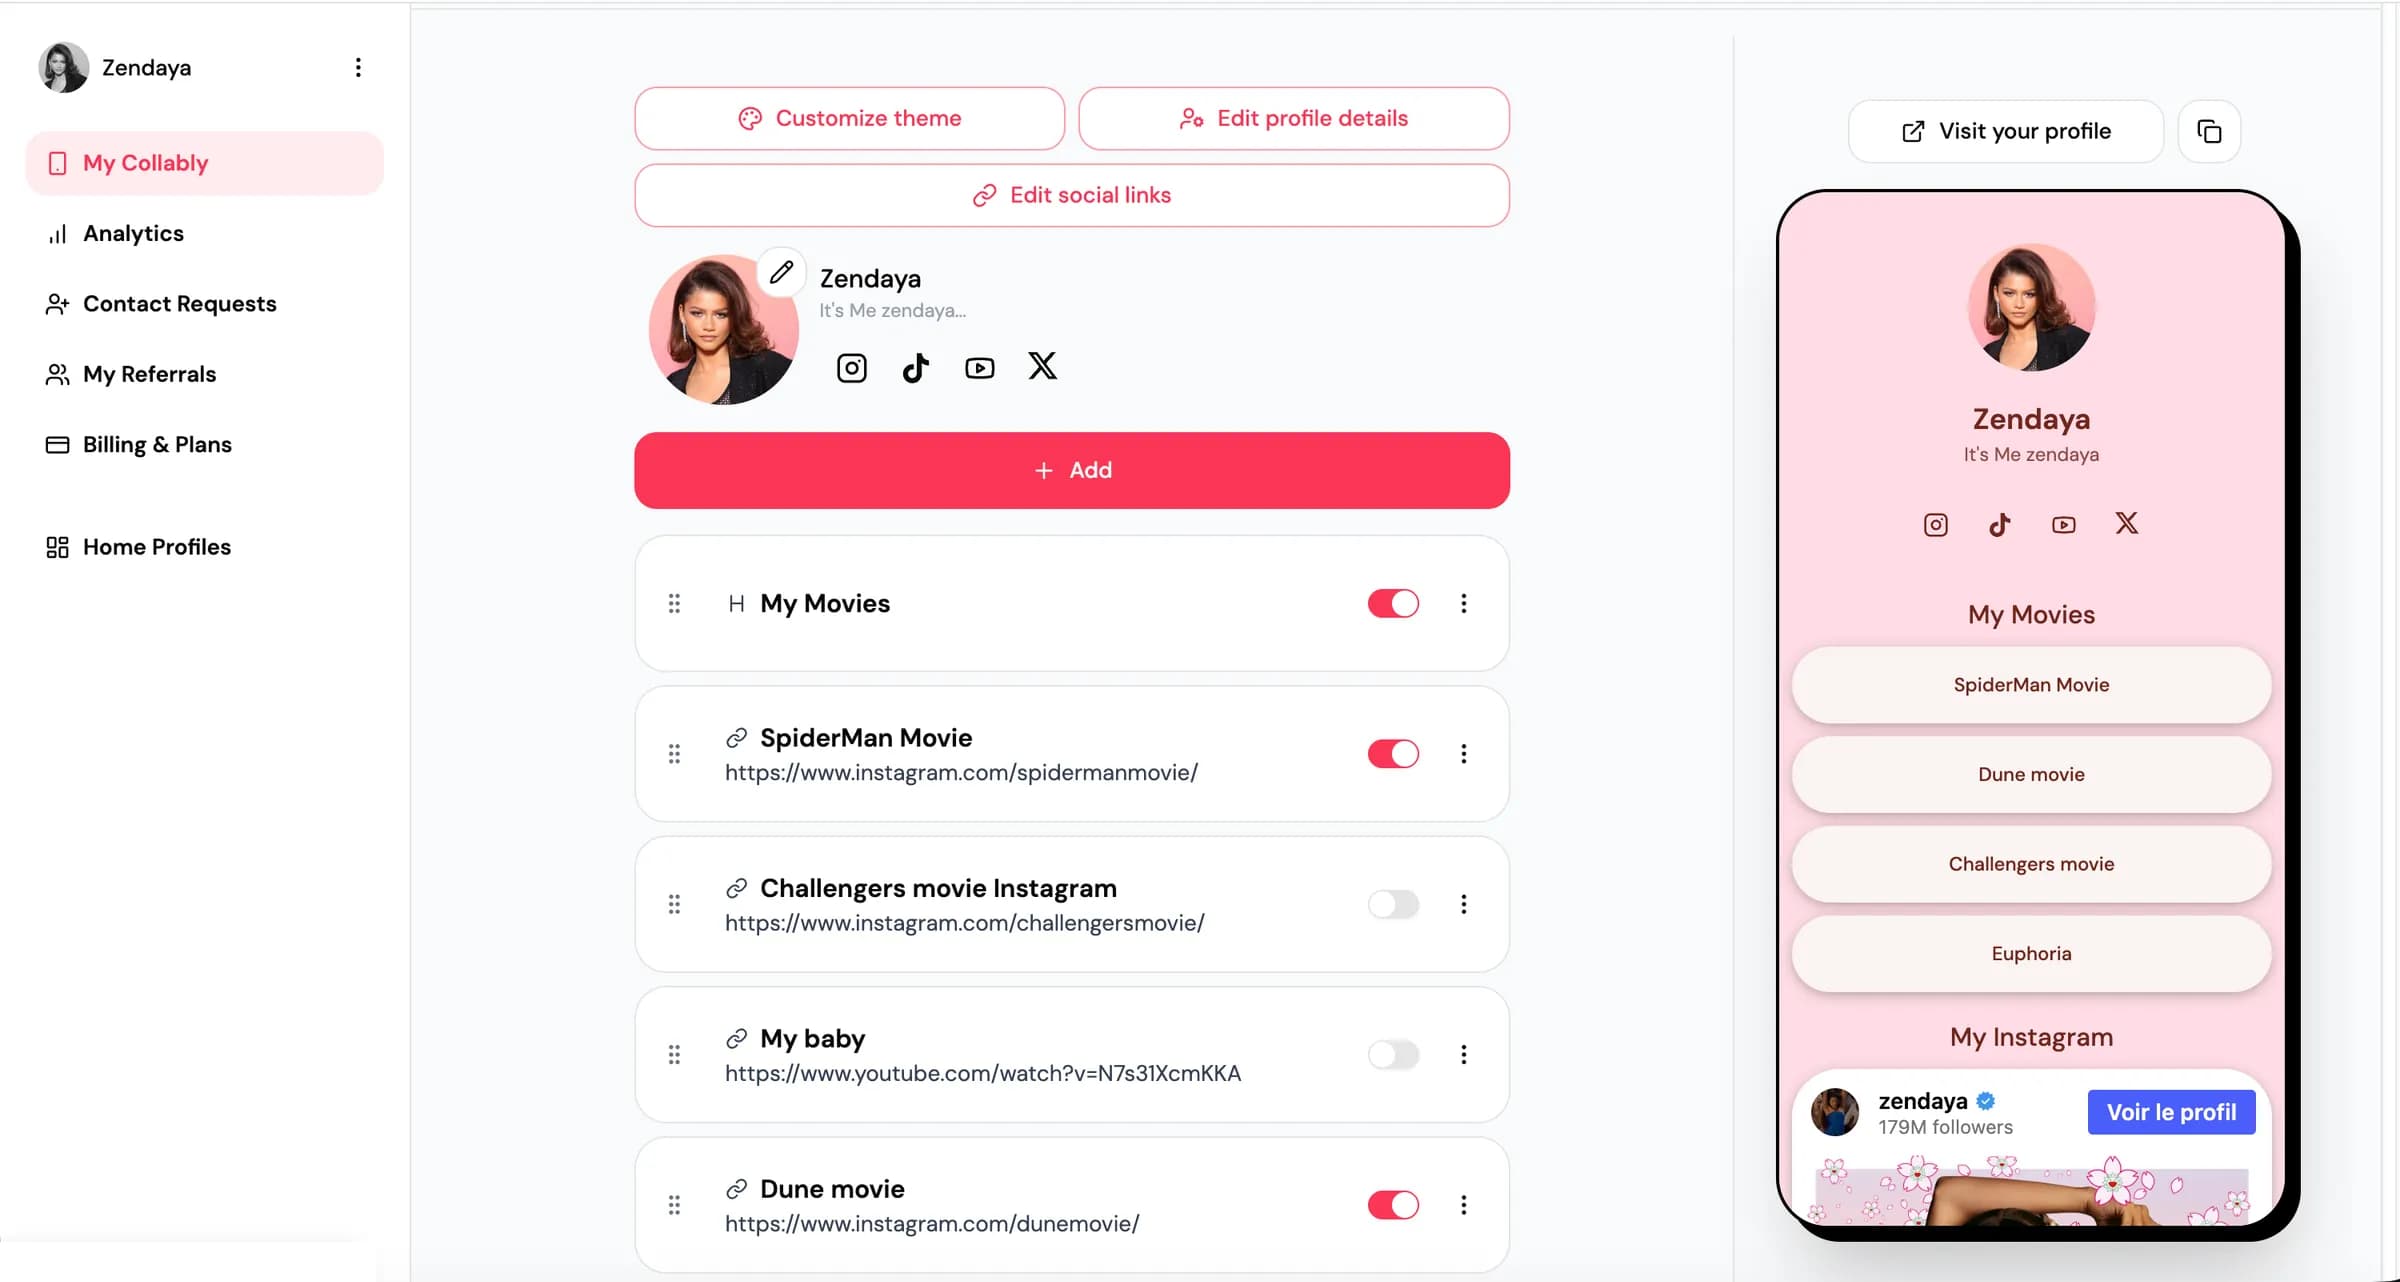
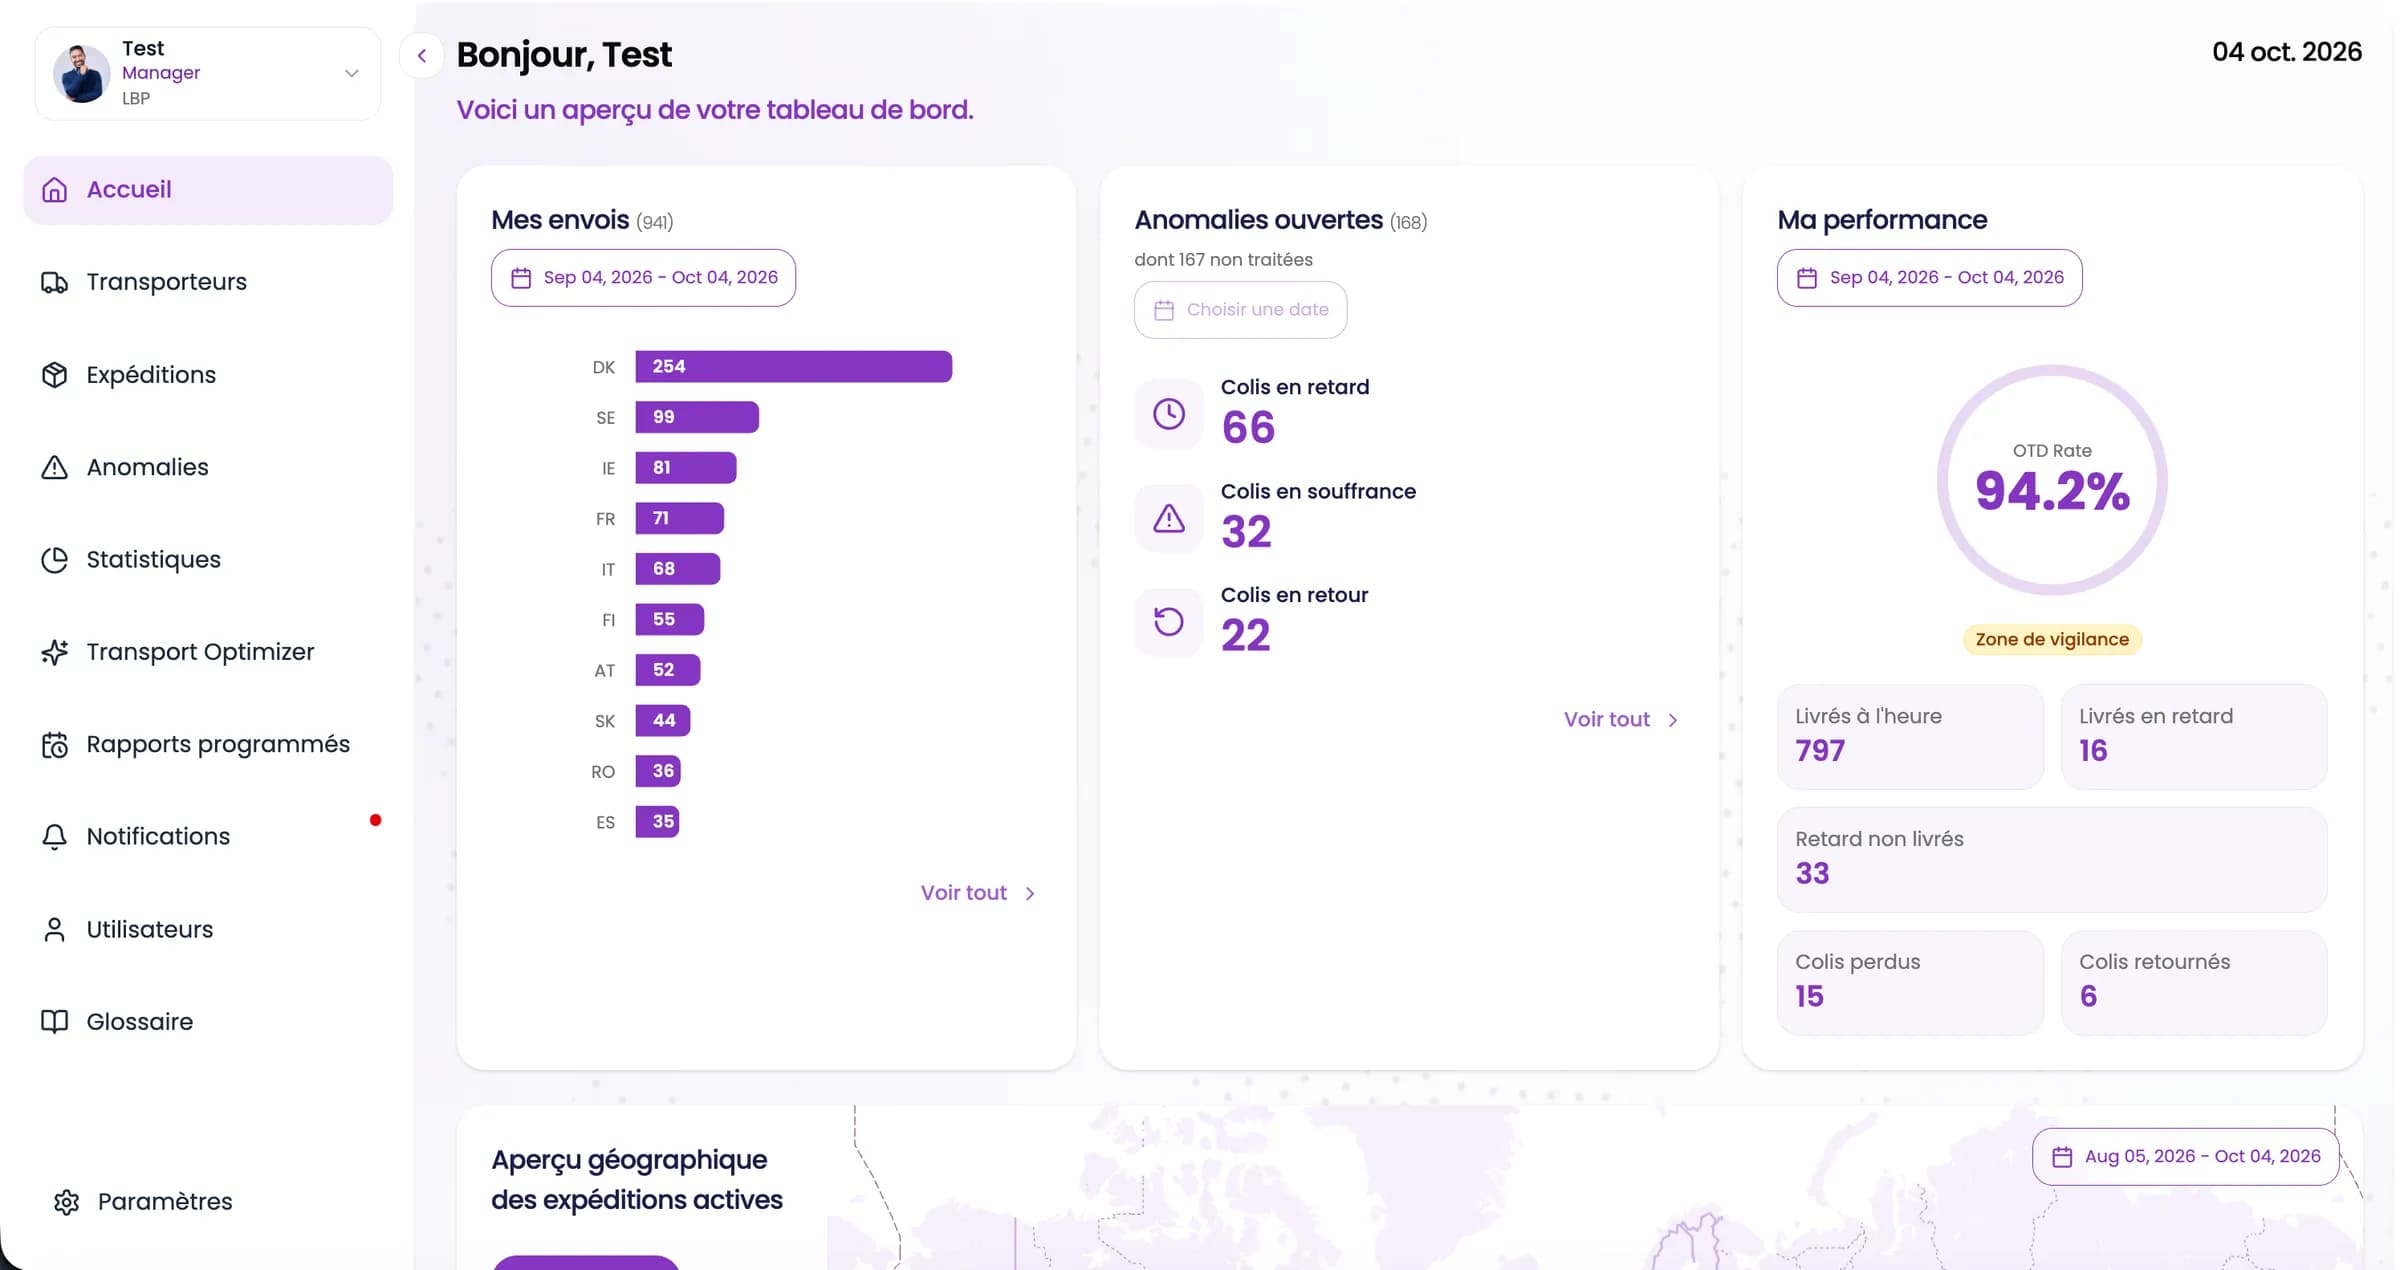
TrackNControl syncs every UPS shipment automatically, detects ten types of anomaly, from late deliveries to customs holds, and turns the data into dashboards, maps, heatmaps, scheduled reports and AI recommendations.
The real product
Screenshots of the live product, taken with demo data. Open any of them full size.
[01]Every shipment in one table, filterable by status and exportable to CSV. Identifiers are hidden here.
[02]Active shipments on the map, filtered by status and by road, air or sea.
[03]Delivery success, on-time rate, failures and delivery time, compared with the previous period.
[04]A city heatmap of on-time rates and anomalies.
[05]The UPS connection, with automatic sync and file import.
A company shipping thousands of parcels a month usually learns about a delay, a customs hold or a lost parcel when the customer complains. The carrier's portal shows parcels one at a time, not which routes keep failing or how often.
TrackNControl watches every shipment for them. The UPS account is connected once and shipments sync on their own. Rules and scheduled checks flag a parcel as soon as it drifts, and every team gets the view it needs: dashboards, a live map, city heatmaps and reports sent on schedule.
A day with TrackNControl
How a logistics manager uses it, from connecting UPS to the weekly report.
Visit the live product- [01]
Connect the UPS account once. Shipments start syncing on their own, and older ones can be imported from a file.
- [02]
Open the home dashboard: shipments this month, open anomalies, the on-time rate and where parcels are heading.
- [03]
Work through the anomalies, from late and at-risk parcels to customs holds and wrong addresses, each with its severity and tracking history.
- [04]
Compare performance by transport mode, period and city in the statistics, on the live map or on the heatmap.
- [05]
Schedule daily, weekly or monthly reports, and let alerts and emails go out on their own.
What it does
We can build a data-heavy SaaS end to end: carrier integration and sync jobs, anomaly rules, AI recommendations, and dashboards that make it all readable.
Automatic UPS sync
Every shipment and tracking event syncs on its own, with file import for anything older. The data model is ready for more carriers.
Ten anomaly types
Late delivery, delivered late, at risk, lost, returned, rescheduled delivery, redirected to a pickup point, wrong address, customs hold, and duties and taxes.
Severity and follow-up
Each anomaly is graded normal, at risk or critical, then followed from detected to in progress to resolved, with a record of who changed what.
Dashboards, maps and heatmaps
A home dashboard, statistics by period and transport mode, anomaly breakdowns, a live map of active shipments and a heatmap by city.
Alerts and reports
Notifications for the team, automatic emails to customers, and daily, weekly or monthly reports scheduled to land in inboxes.
AI recommendations
Recommendations powered by Gemini to resolve recurring anomalies, each with its score, plus a transport optimizer.
How it behaves
One place for every shipment. Whatever happens to a parcel, it shows up in the same place and is measured the same way.
Catch it before the customer does. An anomaly is raised as soon as a parcel drifts from its expected path.
Numbers managers can act on. Every indicator can be filtered by transport mode, period and city, and compared with the period before.
In numbers
- 10Anomaly types detected
- 3Severity levels
- 6Dashboards, maps and heatmaps
The stack
Typed end to end and rendered on the server by default, with the rest chosen for what this product needed.
- Next.js
- React
- TypeScript
- Tailwind CSS
- Node.js
- Express
- MongoDB
- Prisma
- Socket.IO
- Google Maps
- Gemini
- Firebase