How I built it
- My role
- Product, design & engineering
- Context
- Personal project
The problem
[01]Public live data about the planet is everywhere, but it lives in separate tools: a flight tracker, a ship map, an earthquake feed, a satellite catalogue. Each has its own map and its own refresh button, and none of them shows how much is happening on Earth at the same moment.
What I built
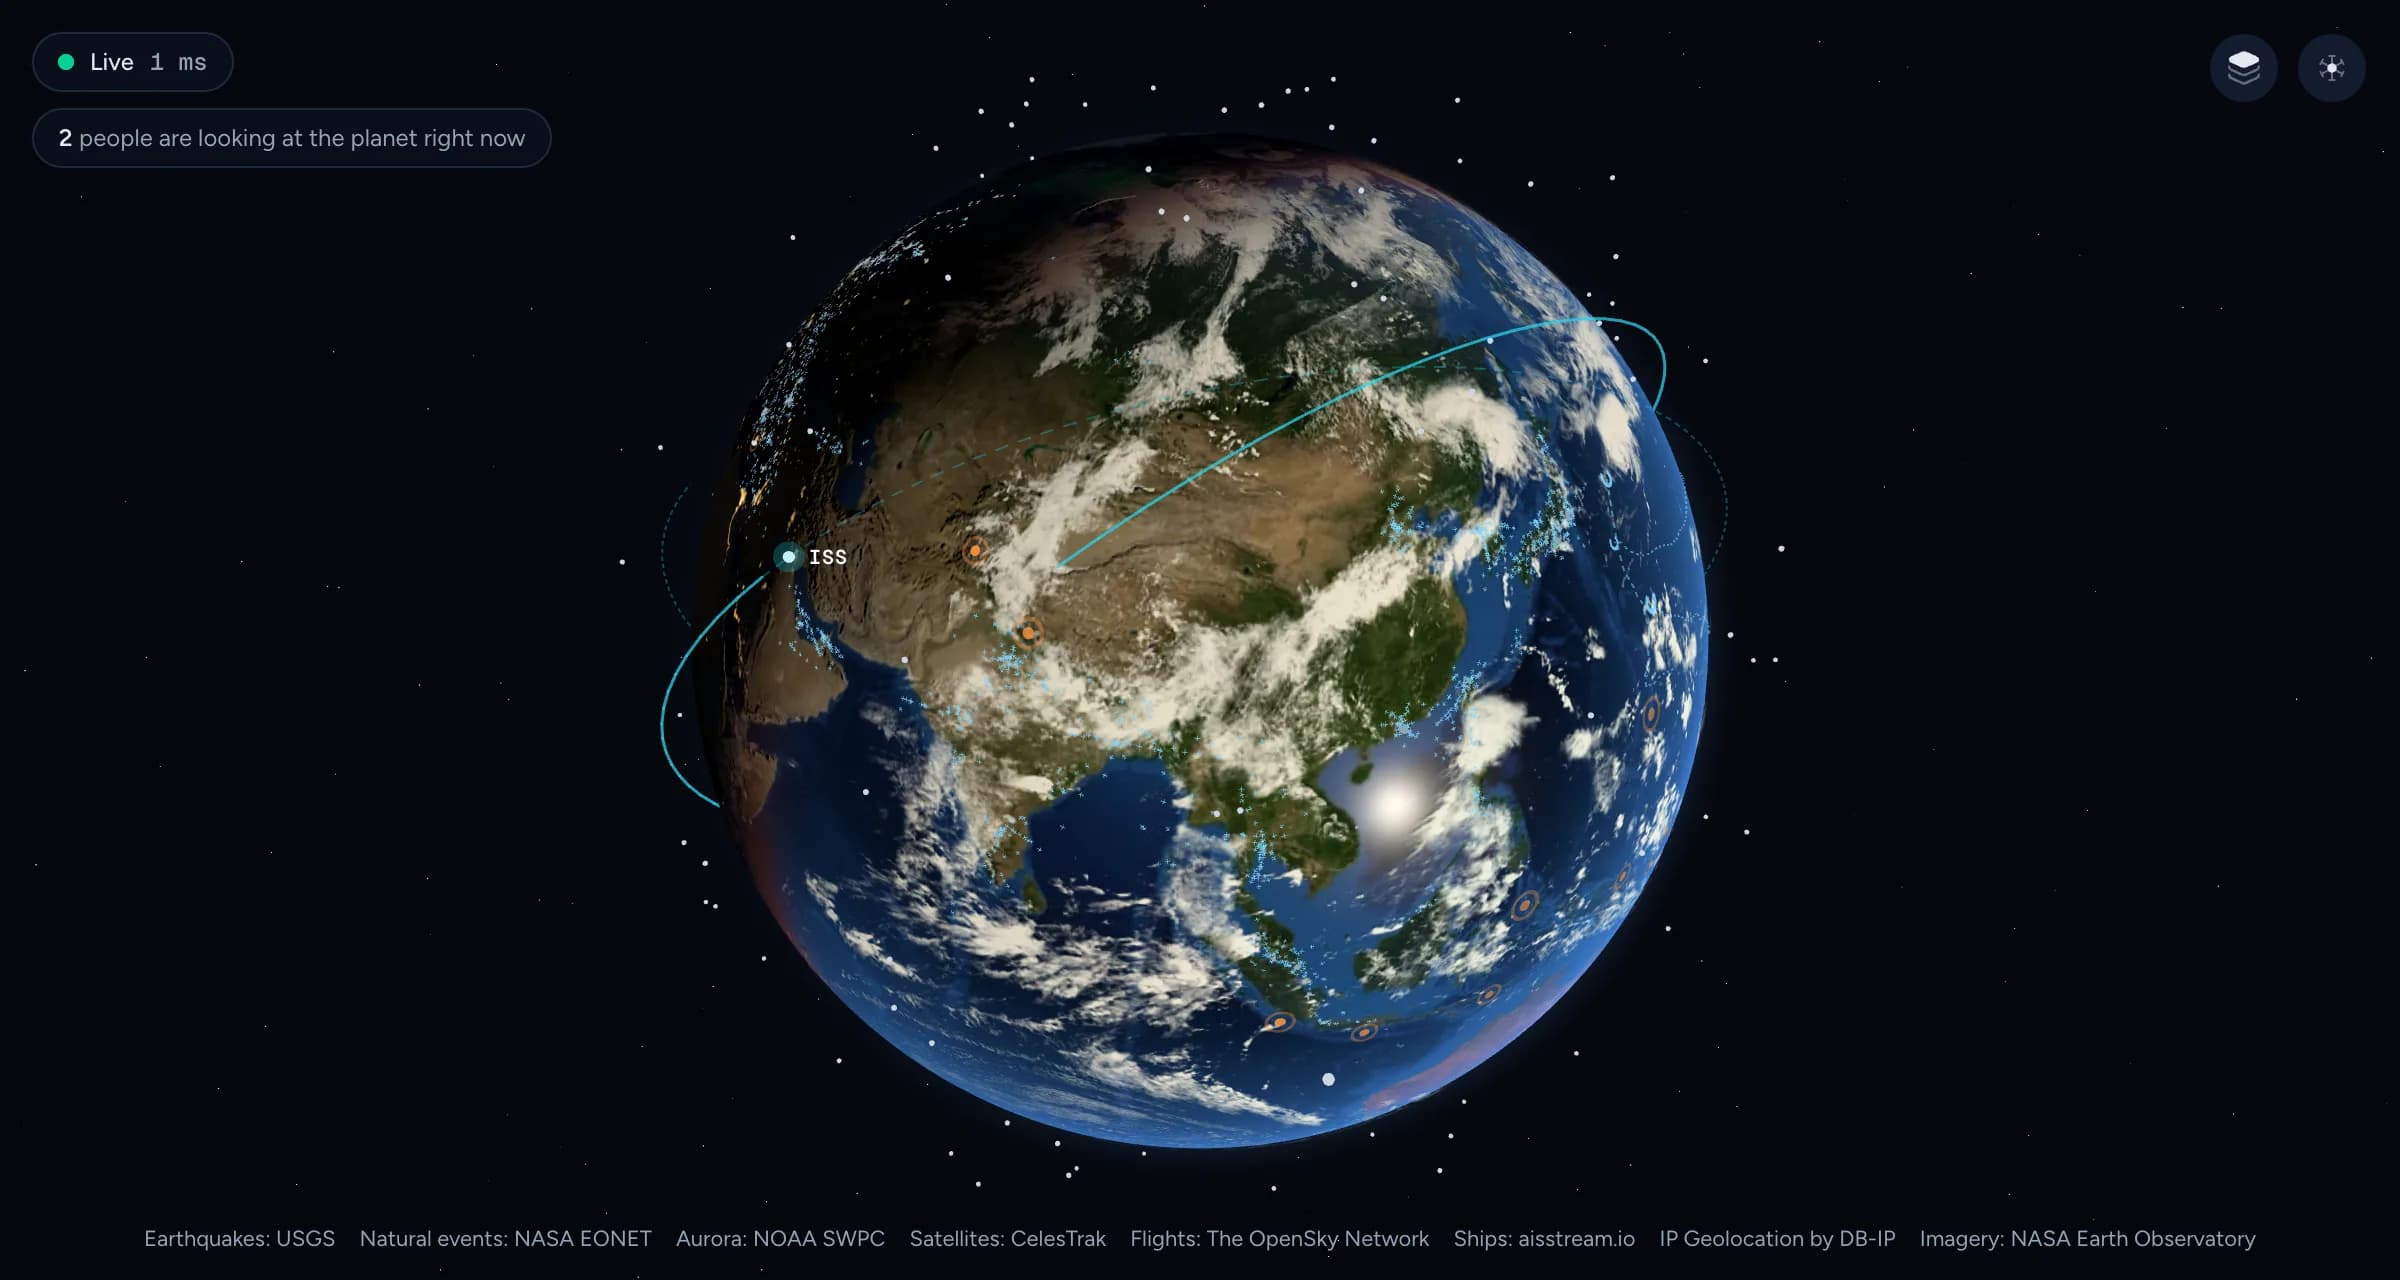
[02]Pulse puts it all on one globe. A small real-time server polls or streams each source within its rate limits, keeps the live state in memory and pushes compact updates to every visitor over a single WebSocket. The browser draws everything in one WebGL scene, with each layer drawn in a single call and aircraft and ships moving along their heading on the GPU until the next update. Turn a layer off and its data stops coming to your browser.
Key decisions
[03]One WebSocket, typed both ways
A Zod protocol shared by the server and the browser: a snapshot on connect, then small compressed updates, only for the layers a visitor has turned on.
30,000 objects, still smooth
Aircraft and ships are drawn as instanced meshes and moved along great circles on the GPU between updates, so the globe stays fluid without streaming every position.
Within every rate limit
OpenSky is polled every 90 seconds to fit its 4,000 daily credits, orbital data is cached for six hours, and the last results survive restarts, so redeploys cost nothing.
The result
- 30k+Aircraft and ships on the globe at once
- 7Live public data sources
- 1WebSocket for everything